Definitions
Any error of measurement detected during calibration as a result of repeat measurements is the so-called systematic measurement error. This remains constant as regards the value and the sign, provided the conditions during measurement do not change and it can always be reproduced under the same conditions. In addition to systematic measurement errors there are also random measurement errors. As the word implies, there is nothing “systematic” about this kind of error, it occurs randomly.
Systematic and random errors
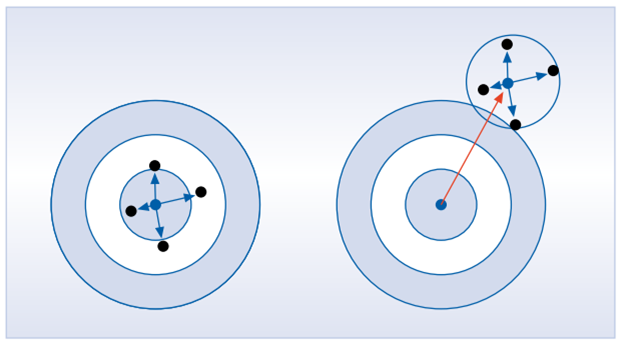
Fig 2.1 illustrates the difference between systematic and random measurement error. If you look at the target on the left, the points (individual values) are evenly distributed around the blue centre, which in this case is defined as the correct value as agreed and the mean is exactly the centre of the target. The blue arrows indicate the random error of the individual values from the mean value. This can also be referred to as a scattering of the points around the mean. In the picture on the right, the same points are all farther from the centre of the target. The resulting systematic error is represented by the orange arrow.
Random measurement errors are caused by such things as reading errors, fluctuations in ambient conditions, unstable process conditions, device characteristics and so on.
Unlike calibration, when adjusting a device the systematic measurement error is not only determined and documented but also corrected by way of a manual intervention in the device. A familiar example of this is “setting” a watch according to the news. When comparing the display on the watch to the reference clock on the television (calibration process), you notice an error. The watch is, for example, five minutes slow (systematic measurement error). Now, although no calibration certificate is issued, you could make a mental note of the error and take that into account each time you look at the watch. However, as a rule this is too much of a hassle for us, and we make the error smaller by resetting the hands on the watch. We have thus adjusted the watch, in other words we have performed a lasting intervention.
Flowmeters are usually calibrated at different flow rates, which can be measured again if necessary. Examples of flowmeter calibration certificates can be found at the end.
Figure 2.1: Systematic and random errors
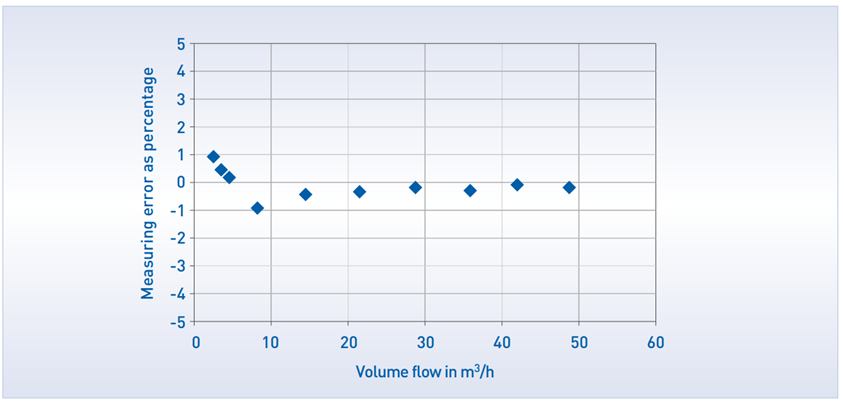
Figure 2.2: Calibration curve of a flowmeter
Calibration curve of a flowmeter
The measurement errors at the different flow rates result in the calibration curve plotted in a table or graph on the calibration certificate, see also pg. 26 ff. In everyday language the calibration curve is also called an error curve. Of course the term calibration curve is not quite right as no intermediate values were measured between the individual points. Using the calibration curve makes it possible to detect to what degree the calibration values fluctuate at the different flow rates; in other words, you can assess the linearity of the flowmeter. The less the individual calibration values deviate from one another overall, the greater the linearity of the measuring device. Calibration values for flowmeters with great linearity across the entire measuring range do not have to be compensated for through corrections within the control centre software of the corresponding application, provided the mean value of the deviations is close enough to zero.
In 1977, calibration laboratories in industrial enterprises, research institutions and technical authorities joined forces to form the Deutschen Kalibrierdienst (DKD) [German calibration service]. The goal was to formally approve the actions of the National Metrology Institute (PhysikalischTechnische Bundesanstalt or PTB), privatise parts of the state duties and responsibilities and thus reduce trade barriers. Accredited DKD laboratories can perform calibrations of measuring devices within the scope of the measurands and measuring ranges determined by the accreditation. The advantage of this is that the measurements can be traced back to the respective measurement standard of a specialist PTB laboratory. The calibration results are documented on a DKD calibration certificate. Today, many DKD laboratories are accredited for a variety of measurement categories including optical, electrical, acoustic, magnetic and dimensional indicators, flow measurements as well as temperature and humidity. Technical committees develop and provide guidelines and manuals for the calibration of the different measurement variables. With the law regarding the accreditation body from 31.07.2009, the DKD accreditation body was transformed with effect from 17.12.2009 into the Deutsche Akkreditierungsstelle GmbH (DAkks) [German Accreditation Body], s.a. www.dakks.de
Influences in practical use
When you consider the calibration values of a flowmeter, ideally they should not deviate from the measuring values in the application.
References and measurement standards
Calibration usually takes place with the help of a “more accurate” measuring device. This device is referred to as the reference, the measurement standard or superior measurement standard.
Calibrations at KROHNE
KROHNE has calibration options for all kind of measuring devices at different locations worldwide.


